suspension geometry
Jan 24 2015
With all this new suspension design work completed, I made an honest attempt at completing an analysis of my design. My technique was to use my 3D model and cycle the suspension components through their range of motion and record the various data points at each increment. There are a couple items to mention with regard to my analysis. Firstly, my struts will only have a total of 6" of travel, 3" in jounce and 3" in rebound so I will limit my analysis to this range of suspension travel. Second, since I designed the suspension with bump steer control to keep it at zero in all conditions, I will not analyse this condition. Thirdly, the stock data that I will be comparing my suspension results to is actually data from an '88 suspension set up ( thanks for the data Dave) which is a significantly different configuration. However, as I am only comparing the results for performance purposes and not trying to actually document the improvements I may or may not have made with my design, the '88 data will do just fine.
The starting point for my analysis is to document the static position of all the suspension components and chassis structure. Here is the rear suspension showing the CG of the car based on the longitudinal engine arrangement.
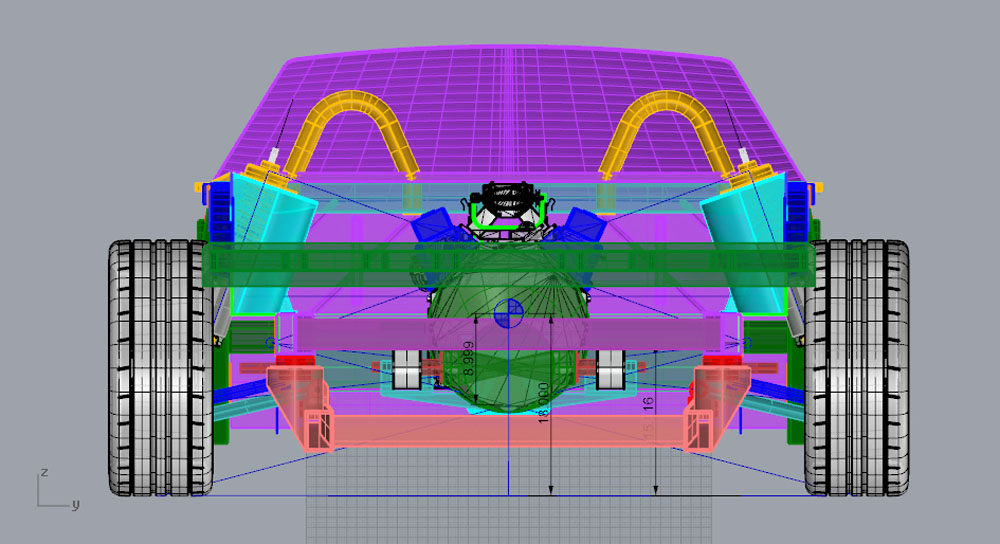
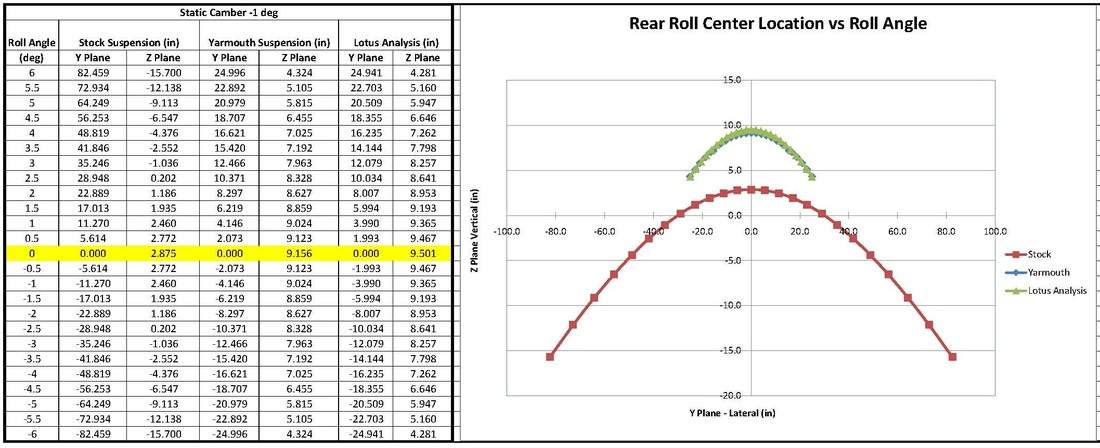
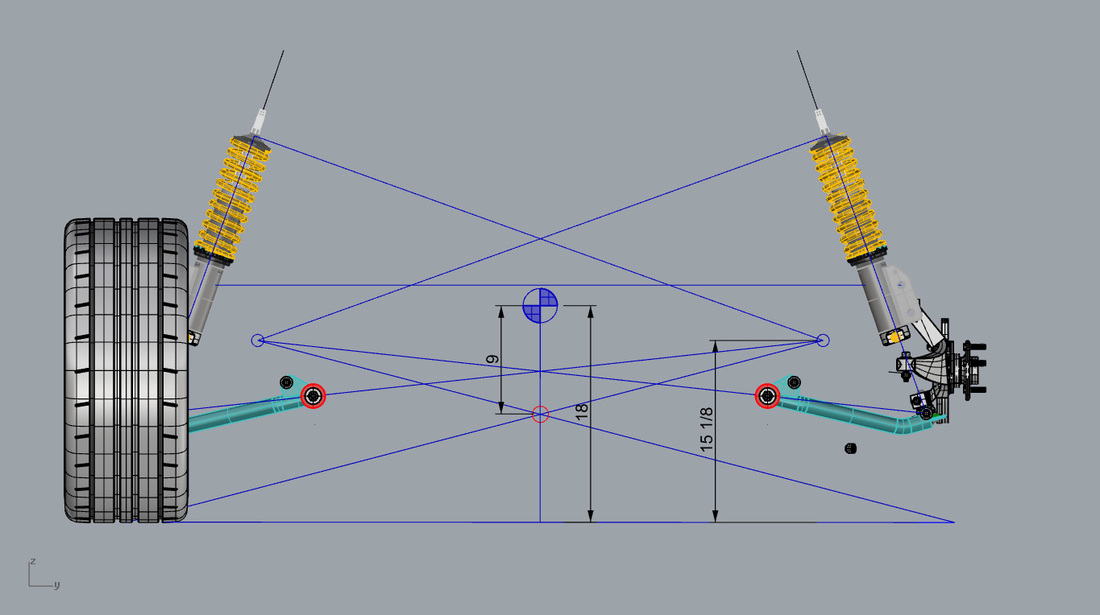
Here is the same set up with the engine and chassis structure and the passenger side wheel removed for clarity. Plotting the suspension points and projecting them provides the roll center locations. As you can see, the roll center ( red circle) is located approximately 9" above the ground on the centerline of the chassis (or 9" below the C of G).
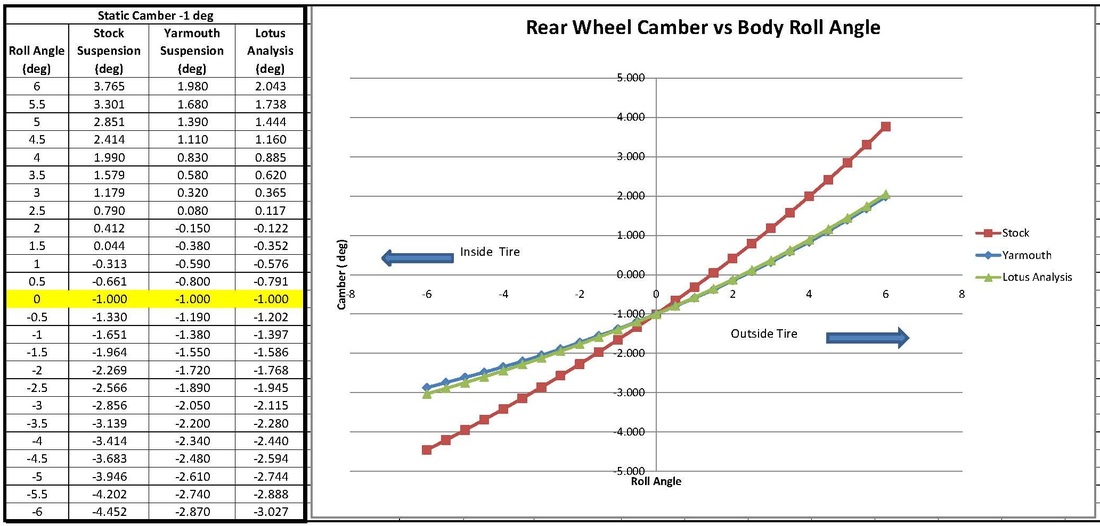
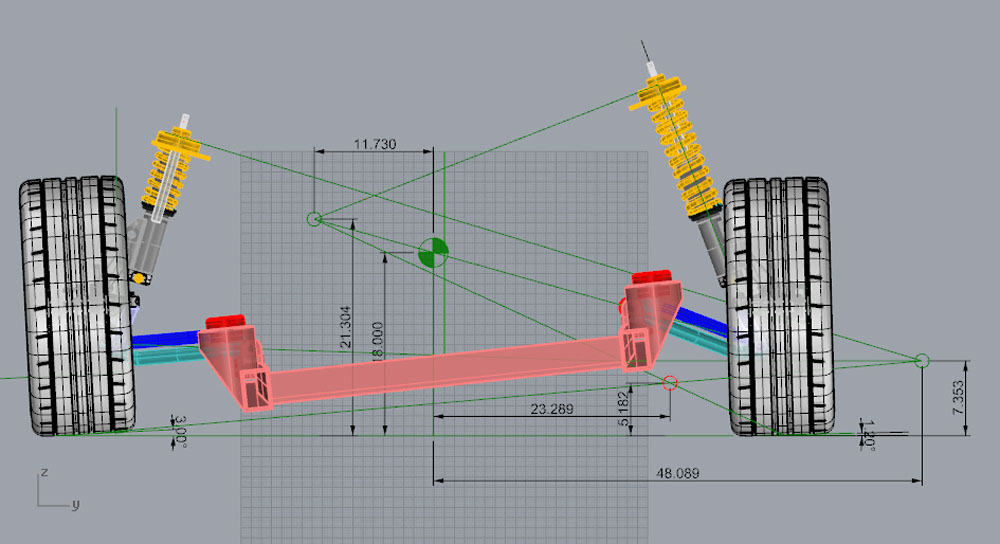
The next step is to roll the chassis 6 degrees which bottoms out the struts at their maximum travel. Then plotting the new instantaneous roll centers for each side of the suspension, it is clear that while they do migrate, the new roll center for the chassis drops to 5.182" above the ground and 23.289" off the centerline of the chassis. This results indicate that the suspension should perform quite well relative to the stock suspension. With regard to rear wheel camber in this condition, the outside wheel will see +3.0 degrees of camber the inboard wheel will see -1.2 degrees of camber. You'll notice that in my static suspension condition, the wheels has zero camber where in fact, they will likely be set up at -1.0 degrees of camber. This would have the effect of reducing the outboard camber to +2.0 and increasing the inboard camber to -2.2 degrees.
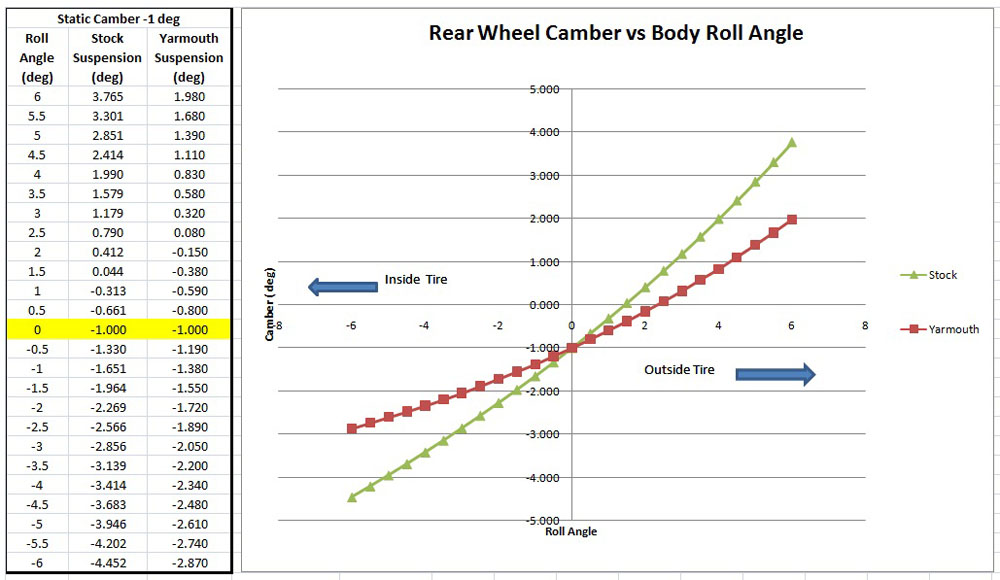
Here are the complete results of the wheel camber vs body roll in 0.5 degree increments. I set the static camber at -1.0 degree for this analysis. The results indicate a significant improvement in wheel camber over the stock suspension data.
The next analysis to complete is the measurement of suspension roll center vs roll angle. As I had noted above in the original chassis drawing showing the suspension rolled to 6 degrees, the roll center of my new suspension design remains above ground level and well within the confines of the chassis. Compared to the stock suspension data, my new suspension design again yields a significant improvement.

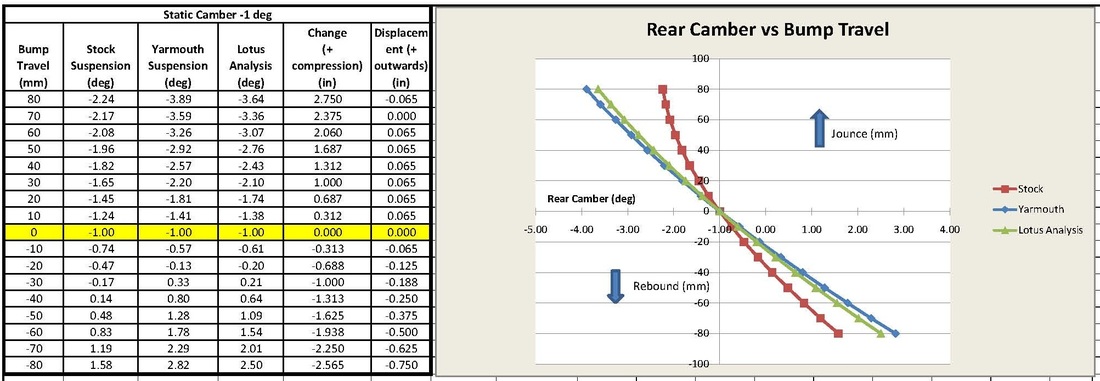
The final analysis that I wanted to complete was camber vs bump travel. Here are the results and like the previous results, there is a significant improvement in my new suspension over the stock configuration. As you can see from the tabular results, in jounce, there is barely 1/16" in lateral wheel displacement.
April 1 2016
If you have been following along with the development of my front suspension, you'll recall that I have been having a very difficult time with the design and its current excessive toe change issues. As a check of my own work, I had a friend of a friend of mine (Zac via Dave) crunch my suspension geometry numbers using his Lotus Suspension Analysis software. The results were detailed and very insightful and have proven to confirm what my own analysis was revealing. This is a huge boost to my self confidence that I am atleast conducting the analysis of my flawed design correctly. I also mentioned that I had provided Zac with the geometry co-ordinates of my rear suspension which I have designed and built almost to completion now. From the results of my analysis above, I have been very pleased with the results as they show a significant improvement in the performance of my design over the stock setup.
So, I took a deep breath tonight and added the Lotus results to my tables and graphs. I would be lying if I said I wasn't nervous when I tabulated and plotted my new results. Remember.......... I have spent alot of time and effort and of course cash to build my rear suspension so finding out now that my analysis had been flawed and that my design was totally Ka-Ka would be crushing.
Well, good news indeed. The Lotus results support my own results with amazing accuracy, considering my results are measured graphically on my 3D model. I'm beaming from ear to ear tonight. :) Here are the updated tables and graphs of the results.